
This chapter covers the following topics:
Commands for viewing status information
Table 4-1 shows some of the commands available for accessing system status and log information:
admin> callroute
usage: callroute -option [ params ]
       -ad list (a)vail (d)ual (net and host) side call routing entries
       -ah list (a)vail (h)ost-side call routing entries
       -an list (a)vail (n)etwork-side call routing entries
       -d  list call routing tables by (d)evice
       -t  (t)oggle module debug level
       -?  display this summary
Getting information about the system
Some MAX TNT commands display real-time information about system activities. Other commands report more static information, such as the system software version. In addition, the MAX TNT maintains log buffers that record different levels of events. This section describes the following commands: Displaying the call-routing database
The call-routing database determines how the MAX TNT routes calls to a modem or to an HDLC card for host-side processing. To display the database, use the Callroute command. For example, the following command displays database entries that route calls to host (modem or HDLC) ports:
admin> callroute -ahFor details about call routing, see the MAX TNT Hardware Installation Guide.
device # source type tg sa phone
1:16:01/3 0 0:00:00/0 digital-call-type 0 0
1:16:01/4 0 0:00:00/0 digital-call-type 0 0
1:16:01/5 0 0:00:00/0 digital-call-type 0 0
1:16:01/6 0 0:00:00/0 digital-call-type 0 0
1:16:01/7 0 0:00:00/0 digital-call-type 0 0
1:16:01/8 0 0:00:00/0 digital-call-type 0 0
1:16:01/9 0 0:00:00/0 digital-call-type 0 0
1:16:01/10 0 0:00:00/0 digital-call-type 0 0
1:16:01/11 0 0:00:00/0 digital-call-type 0 0
1:16:01/12 0 0:00:00/0 digital-call-type 0 0
1:16:01/13 0 0:00:00/0 digital-call-type 0 0
1:16:01/14 0 0:00:00/0 digital-call-type 0 0
1:16:01/15 0 0:00:00/0 digital-call-type 0 0
1:16:01/16 0 0:00:00/0 digital-call-type 0 0
1:16:01/17 0 0:00:00/0 digital-call-type 0 0
1:16:01/18 0 0:00:00/0 digital-call-type 0 0
1:16:01/19 0 0:00:00/0 digital-call-type 0 0
1:16:01/20 0 0:00:00/0 digital-call-type 0 0
1:16:01/21 0 0:00:00/0 digital-call-type 0 0
1:16:01/22 0 0:00:00/0 digital-call-type 0 0
1:16:01/23 0 0:00:00/0 digital-call-type 0 0
1:16:01/24 0 0:00:00/0 digital-call-type 0 0
[More? <ret>=next entry, <sp>=next page, <^C>=abort]
admin> fatal-historyEach entry shows the system software version (2.0 in the sample entries above), the slot on which the error occurred, and the date and time at which the error occurred. To clear the log, enter the Clr-History command:
FATAL ERROR: Index: 1 Revision: 2.0 Slot 13 (tnt8t1)
Date: 02/16/1998. Time: 12:01:10
Location: 1006f87c 10000068 10068384 10067cec 100677e0 100585dc
FATAL ERROR: Index: 1 Revision: 2.0 Slot 13 (tnt8t1)
Date: 02/16/1998. Time: 12:25:10
Location: 1006f87c 10000068 10068384 10067cec 100677e0 100585dc
admin> clr-history
error by default, which means that messages indicating an error condition should be displayed immediately.If you are working in the interface and need to temporarily turn off unlogged diagnostic output, use the Debug command. For example:
admin> debug offTo turn it back on:
Diagnostic output disabled
admin> debug on
Diagnostic output enabled.
-s option:
admin> userstat -sThe SessionID field shows the unique ID assigned to the session.
SessionID Line/Chan Slot:Item Tx/Rx Rate Svc Address Username
228687860 1.01.02/01 1:03:01/01 56K/56K PPP 10.100.0.1 barney
228687861 1.02.03/02 1:04:02/00 28800/33600 PPP 10.168.6.24 jake
<end user list> 2 active user(s)
The Line/Chan field shows the physical address (shelf.slot.line/channel) of the network port on which the connection was established (for example, a T1 line/channel).
The Slot:Item field shows shelf:slot:item/logical-item of host port to which the call was routed (for example, to a modem or HDLC-channel).
The Tx/Rx Rate fields show the transmit and receive rate, respectively. Note that for digital connections, the transmit rate is the same as the receive rate. Usually only modems use asymmetric data-rate connections.
The Svc field contains a three-letter code that shows the type of service in use for the session. (For details, see the MAX TNT Reference Guide.)
Getting information about slot cards
This section provides a few examples of how to check the status of slot cards and the individual ports or channels on the card. The examples use the following commands:
Using the Show command
The Show command displays information about the status of installed slot cards. For example:
admin> showThe status of a slot can be one of the following:
Shelf 1 ( standalone ):
{ shelf-1 slot-1 0 } UP 8t1-card
{ shelf-1 slot-2 0 } UP 48modem-card
{ shelf-1 slot-3 } OCCUPIED
{ shelf-1 slot-4 0 } UP 4ether-card
{ shelf-1 slot-5 0 } UP 128hdlc-card
-a option:
admin> hdlc -aThis output shows the interface address of each HDLC channel (six groups of 32 channels), followed by the operational status, up-state, required-state, and admin-state of each channel.
HDLC channels available for use:
(dvOp dvUpSt dvRq sAdm)
HDLC { { 1 5 1 } 1 } (Up Idle UP UP )
HDLC { { 1 5 1 } 2 } (Up Idle UP UP )
HDLC { { 1 5 1 } 3 } (Up Idle UP UP )
HDLC { { 1 5 1 } 4 } (Up Idle UP UP )
HDLC { { 1 5 1 } 5 } (Up Idle UP UP )
HDLC { { 1 5 1 } 6 } (Up Idle UP UP )
HDLC { { 1 5 1 } 7 } (Up Idle UP UP )
HDLC { { 1 5 1 } 8 } (Up Idle UP UP )
HDLC { { 1 5 1 } 9 } (Up Idle UP UP )
HDLC { { 1 5 1 } 10 } (Up Idle UP UP )
HDLC { { 1 5 1 } 11 } (Up Idle UP UP )
HDLC { { 1 5 1 } 12 } (Up Idle UP UP )
HDLC { { 1 5 1 } 13 } (Up Idle UP UP )
HDLC { { 1 5 1 } 14 } (Up Idle UP UP )
HDLC { { 1 5 1 } 15 } (Up Idle UP UP )
HDLC { { 1 5 1 } 16 } (Up Idle UP UP )
HDLC { { 1 5 1 } 17 } (Up Idle UP UP )
HDLC { { 1 5 1 } 18 } (Up Idle UP UP )
HDLC { { 1 5 1 } 19 } (Up Idle UP UP )
HDLC { { 1 5 1 } 20 } (Up Idle UP UP )
HDLC { { 1 5 1 } 21 } (Up Idle UP UP )
[More? <ret>=next entry, <sp>=next page, <^C>=abort]
-g option:
admin> modem -gThis output shows the address of each modem, the operational state (UP or DOWN) the status (Idle or Active), SNMP interface information, and whether the modem has been disabled.
Non-suspect modems available for use:
(dvOp dvUpSt dvRq sAdm mDis)
Modem { 1 11 1 } (Up Idle UP UP ENABLE )
Modem { 1 11 2 } (Up Idle UP UP ENABLE )
Modem { 1 11 3 } (Up Idle UP UP ENABLE )
Modem { 1 11 4 } (Up Idle UP UP ENABLE )
Modem { 1 11 5 } (Up Idle UP UP ENABLE )
Modem { 1 11 6 } (Up Idle UP UP ENABLE )
Modem { 1 11 7 } (Up Idle UP UP ENABLE )
Modem { 1 11 8 } (Up Idle UP UP ENABLE )
Modem { 1 11 9 } (Up Idle UP UP ENABLE )
Modem { 1 11 10 } (Up Idle UP UP ENABLE )
Modem { 1 11 11 } (Up Idle UP UP ENABLE )
Modem { 1 11 12 } (Up Idle UP UP ENABLE )
Modem { 1 11 13 } (Up Idle UP UP ENABLE )
Modem { 1 11 14 } (Up Idle UP UP ENABLE )
Modem { 1 11 15 } (Up Idle UP UP ENABLE )
Modem { 1 11 16 } (Up Idle UP UP ENABLE )
[More? <ret>=next entry, <sp>=next page, <^C>=abort]
Working with the status window
The MAX TNT generates a continuous stream of statistics about its activities. You can specify in a User profile that these statistics should always be displayed when a user logs in with that profile. Or, you can simply display the status window on demand.
To display the status window and control what information is contained in which part of the window, use the following commands:
Opening and closing the status window
The status window has three main areas:
admin> statusThe system prompt moves to just below the status window. To close the status window, enter the command again:
admin> statusIf the system prompt is not visible below the status window, press Escape to display it.
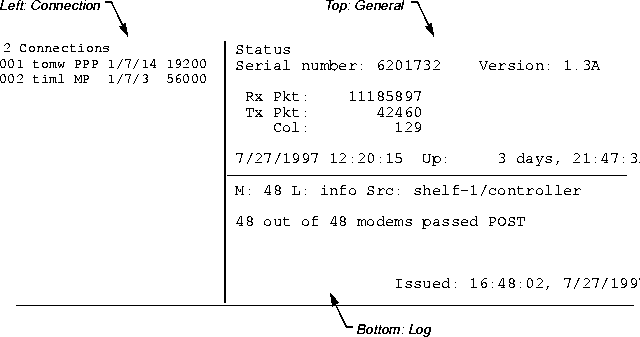
Figure 4-1. Information in the status window
left-status = connection-list
top-status = general-info
You can change these defaults by modifying your User profile.bottom-status = log-window
admin> connectionIn effect, this command puts the window in connection-status mode, with the following message displayed below the status window:
[ Next/Last Conn: <dn/up arw>, Next/Last Page: <pg dn/up>, Exit: <esc> ]This message indicates the keystroke sequences you can use for displaying additional information in the Connection status area. The Down Arrow and Up Arrow keys display the next or previous connection in the list of active connections. The Page Down and Page Up keys display the list a screen at a time.
When the connection-status mode message is displayed, the system prompt does not appear at the bottom of the window. Press the Escape key to exit this mode and return to the system prompt.
If the top of the status window is displaying another kind of information, such as T1 line information, you can redisplay the general status information with the View command:
admin> view top general
If the status window is not already displayed, the following Log command:
admin> logopens it, with log-message information displayed in the bottom of the window.
Or, you can use the following command to specify that log messages appear in the top of the window instead, replacing the general status information:
admin> log topIn effect, these commands put the window in log mode, which displays the following message below the status window:
[ Back:<up arw>, Forward:<dn arw>, Start:<pg up>, End:<pg dn>, Exit: <esc> ]This message indicates the key sequences you can use for displaying additional information in the Log area. The Down Arrow and Up Arrow keys display the next and previous message in the buffer, respectively. The Page Up and Page Down keys display the last and first message in the buffer, respectively.
When the log-mode message is displayed, the system prompt does not appear at the bottom of the window. Press the Escape key to exit this mode and return to the system prompt.
If the status window is not already displayed, the following Line command opens it with T1 line status information displayed in the bottom (lower-right) of the window:
admin> lineOr, you can use the following command to specify that the line-status information appear in the top of the window instead, replacing the general status information:
admin> line topYou can view information about all T1 lines installed in the system if you wish, but the default is to show information only about enabled lines. To view the status of all lines:
admin> line allIn effect, the Line commands put the window in line-status mode, which displays the following message below the status window:
[ Next/Last Line: <dn/up arw>, Next/Last Page: <pg dn/up>, Exit: <esc> ]This message indicates the key sequences you can use for displaying additional information in the line status area. The Down Arrow and Up Arrow keys display the next or previous T1 line in the list. The Page Down and Page Up keys display the list a screen at a time.
When the line-status mode message is displayed, the system prompt does not appear at the bottom of the window. Press the Escape key to exit this mode and return to the system prompt.
Copyright © 1998, Ascend Communications, Inc. All rights reserved.